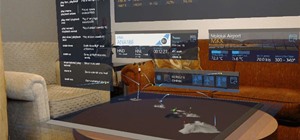
HoloLens developer Michael Peters of In-Vizible has released quite a few videos since receiving his HoloLens last year. Many of his experiments are odd and funny, but some include serious potential approaches to data visualization. In the videos embedded below, you'll specifically see stock market information beautifully rendered in different ways to help understand the data.
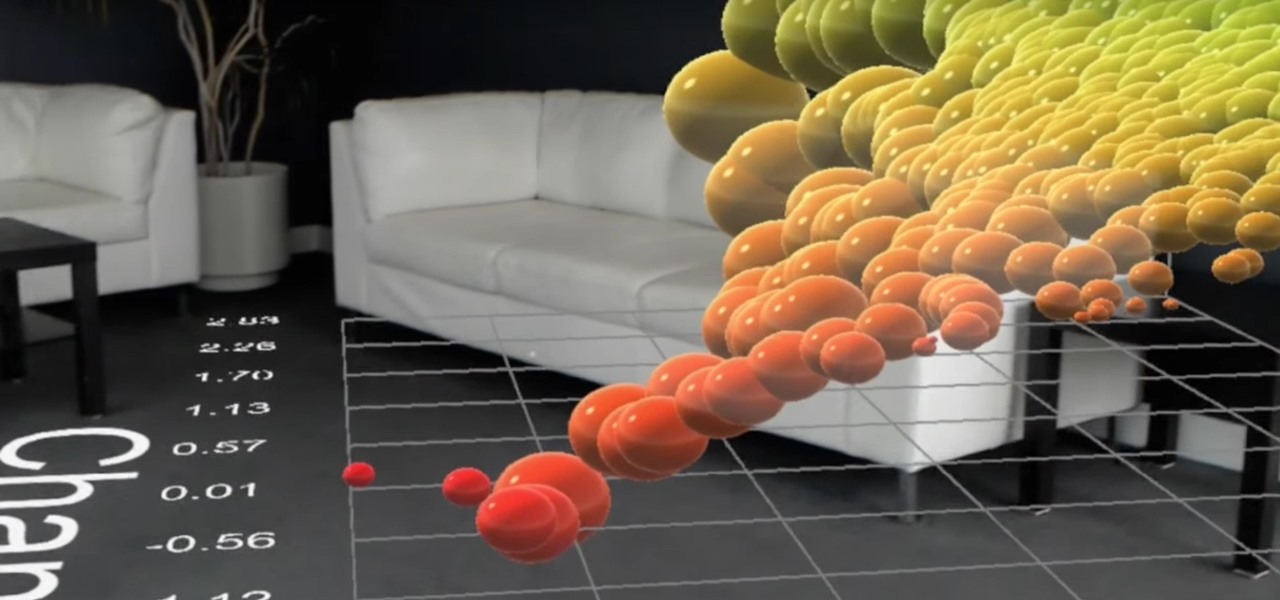
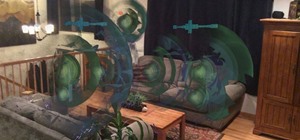
In Peters' blog, he lists the various modes seen in the video above (as well as in the ones below) as the Këpler, Grid Array, 3D Scatterplot, and Tubes views.
Këpler view appears to be small planets with partial rings orbiting them. The various metrics being displayed take into account the size and color of the planets and rings, as well as the orbit and rotation speed.
Grid Array view is a far more simple scene using columns of various width and heights, as well as colors, to represent the data presented.
3D Scatterplot view plots spherical shapes in an X, Y, and Z coordinate system. Again, color and size look to represent various metrics as well.
Tubes view is a visualization type that is still in the concept phase, according to Peters.
I was thinking that it would be interesting to present data in a sorted grid view, but allow the visualization to show where that element was over time. Imagine a stock market dataset, showing end of day prices. However, instead of a bar, it would be presented as a tube, with the opening price at the base of the 'tube' and the closing price at the top. This would highlight how much (or little) the stock had changed over the course of the day. The data represented in the video is simulated random data.
Currently, one of the main factors that separates the human brain from the ultra-fast computers we now use is our capacity for fast pattern recognition, be it visual, aural, or conceptual. Our ability to quickly see even a small blotch of colors from a distance and instantly recognize it as the icon to a program that we use with regularity is something computers cannot do yet. Advances in quantum computing, machine learning, and artificial intelligence are beginning to close that gap.
While computers can be taught to look for patterns in large data sets at fairly slow rates, stock market information is fast changing and requires a quick response. A human, which is capable of abstract thought and creative thinking, trained to see and interpret data, can far more quickly see a trend forming and respond. The types of experiments shown in these videos are important to advancing those capabilities for human beings.
How long do you think it will take computers to catch up to our capacity for pattern recognition? Will computers ever be capable of abstract or creative thought? Let us know in the comments below.
Just updated your iPhone? You'll find new features for Podcasts, News, Books, and TV, as well as important security improvements and fresh wallpapers. Find out what's new and changed on your iPhone with the iOS 17.5 update.






Be the First to Comment
Share Your Thoughts